eBPF
This is a collection of useful commands and infos of eBPF.
It is a bit unordered list of gathered knowledge. (Maybe I am rewriting this in
a comprehensible blog post ... somewhen)
eBPF Documentation:
Github Recommendation:
Books Recommendation:
- Learning eBPF from Liz Rice: ISBN: 9781098135119
General
In order to debug a compiled eBPF program you can just do so by:
llvm-objdump -d <program>
About KProbes
Resources:
- https://dev.to/maheshrayas/-03-lets-understand-kprobes-kretprobes-4ke
- https://lwn.net/Articles/132196/ - Good article, but keep in mind this was written in 2005 for
kernel 2.6.11.7;) - https://www.kernel.org/doc/html/latest/trace/kprobes.html#how-does-a-kprobe-work
- https://docs.ebpf.io/linux/program-type/BPF_PROG_TYPE_KPROBE/
Look for uppercase T symbols so you know what you can hook
cat /proc/kallsyms
Workflow:
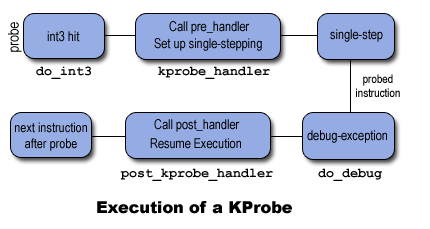
Image yoinked from here
About Tracepoints
Resources:
Tracepoints are a different approach of hooking into kernel code. In contrast
to krpobes, they are defined by the TRACE_EVENT macro.
You can find a list of events you can trace in /sys/kernel/tracing/events/
In case there is nothing mounted at this destination check out, where your
distro mounts the tracefs.
You can do a little yoinki on the format file to check out on how to use
the tracepoint e.g.:
sudo cat /sys/kernel/tracing/events/syscalls/sys_enter_read/format
This would output
name: sys_enter_read
ID: 822
format:
	field:unsigned short common_type;	offset:0;	size:2;	signed:0;
	field:unsigned char common_flags;	offset:2;	size:1;	signed:0;
	field:unsigned char common_preempt_count;	offset:3;	size:1;	signed:0;
	field:int common_pid;	offset:4;	size:4;	signed:1;

	field:int __syscall_nr;	offset:8;	size:4;	signed:1;
	field:unsigned int fd;	offset:16;	size:8;	signed:0;
	field:char * buf;	offset:24;	size:8;	signed:0;
	field:size_t count;	offset:32;	size:8;	signed:0;

print fmt: "fd: 0x%08lx, buf: 0x%08lx, count: 0x%08lx", ((unsigned long)(REC->fd)), ((unsigned long)(REC->buf)), ((unsigned long)(REC->count))
Beware of the types! You need to carefully check the size and signed values
due to depending on your type definitions, they might not be correct with the
type provided in the field. Make use of __s8, __u8 etc from vmlinux.h.
For this specific syscall the struct would look like this:
struct trace_event_sys_enter_read {
  __u16 common_type;
  __u8 common_flags;
	__u8 common_preempt_count;
	__s32 common_pid;

	__s8 __syscall_nr;
  __u64 fd;
	__u64 * buf;
	__u64 count;
};
btw. also check out if the vmlinux.h already implements your tracepoint (search for trace_event_)
Stack
Stak Size is 512 bytes:
- https://github.com/torvalds/linux/blob/841c35169323cd833294798e58b9bf63fa4fa1de/tools/include/linux/filter.h#L28
- https://mostlynerdless.de/blog/2024/02/12/hello-ebpf-tail-calls-and-your-first-ebpf-application-4/
For more information on how the stack is working:
Tail Calls
Tail calls:
- https://mostlynerdless.de/blog/2024/02/12/hello-ebpf-tail-calls-and-your-first-ebpf-application-4/
- https://github.com/netoptimizer/prototype-kernel/blob/master/kernel/samples/bpf/bpf_tail_calls01_kern.c
Tail calls allows you to split apart complex code logic. You can imagine this
being a goto definition, however tail calls never return to the callee,
making it a one-way call. The verifier treats the tail call as a new eBPF
program allowing you to make use of more resources (as the stack is usually
limited to 512 bytes. So with a tail call your new eBPF program has access
to the full 512 bytes), e.g. with 2 tail calls you gain 1KB of stack size.
Loops
bpftool
This tool allows you to inspect and debug all your ebpf programs including all data structures you are creating on the way to your program e.g. maps etc.
# Lists programs
bpftool prog list

# Lists maps
bpftool map list

# Shows info about a map
bpftool map show name <name> # or show id <id>

# Dumps content of map
bpftool map dump id <id>
Resolving a dentry path
If you want to resolve an path you can use bpf_d_path. However, this is only available to some specific functions:
BTF_SET_START(btf_allowlist_d_path)
#ifdef CONFIG_SECURITY
BTF_ID(func, security_file_permission)
BTF_ID(func, security_inode_getattr)
BTF_ID(func, security_file_open)
#endif
#ifdef CONFIG_SECURITY_PATH
BTF_ID(func, security_path_truncate)
#endif
BTF_ID(func, vfs_truncate)
BTF_ID(func, vfs_fallocate)
BTF_ID(func, dentry_open)
BTF_ID(func, vfs_getattr)
BTF_ID(func, filp_close)
BTF_SET_END(btf_allowlist_d_path)
Source: https://github.com/torvalds/linux/blob/62ef449b8d8e312ee06279da797702cdb19a9920/kernel/trace/bpf_trace.c#L932 There is a patch for exposing this helper to more functions, however this patch is not accepted yet:
In case you want to resolve an path outside those functions, you have to write your own path constructor. This is a bit tricky due to 1) you have a limited stack and 2) you only have struct dentry* available, so you have to construct the path by yourself:
See implementation ideas from github, my query was bpf_probe_read ->d_parent to find references iterating over d_parent member.
- https://github.com/kubearmor/KubeArmor/blob/ae5943c9eb3c626748665bb4b4ad35f129d6d4f5/KubeArmor/BPF/system_monitor.c#L744
- https://github.com/Gui774ume/fsprobe/blob/97d2b70097769fb45eb36084ff3fdef8fd288eda/ebpf/dentry.h#L208
- https://github.com/bookingcom/bpfink/blob/30deb2f00d497051402807fcee4e909d9a9c2b15/pkg/ebpf/vfs.c#L366
Maps
Documentation on maps:
About PERF_RECORD_LOST
When using perf_buffer__new you are gonna have a handle_event and
lost_event. The handle_event handles event which you are sent from withtin
the eBPF kernel program, while the lost_event will be called whenever you
were too slow handling an event. So whenever the ring buffer gets full, it is
called.
An excerpt from the userspace api documentation:
The non-overwrite ring buffer uses the read-write mapping with forward
writing.  It starts to save data from the beginning of the ring buffer
and wrap around when overflow, which is used with the read-write mode in
the normal ring buffer.  When the consumer doesn't keep up with the
producer, it would lose some data, the kernel keeps how many records it
lost and generates the ``PERF_RECORD_LOST`` records in the next time
when it finds a space in the ring buffer.
Ring Buffers
In eBPF you usually can use perf buffers or ring buffers to send a huge amount of data to the userspace. However, perf buffers have some drawbacks, as they have ineffificent memory usage and event reordering making it a bit slower than ring buffers. Therefore in 5.18 ring buffers where introduced.
The image below shows how the ring buffers are connected between the user and kernel space.
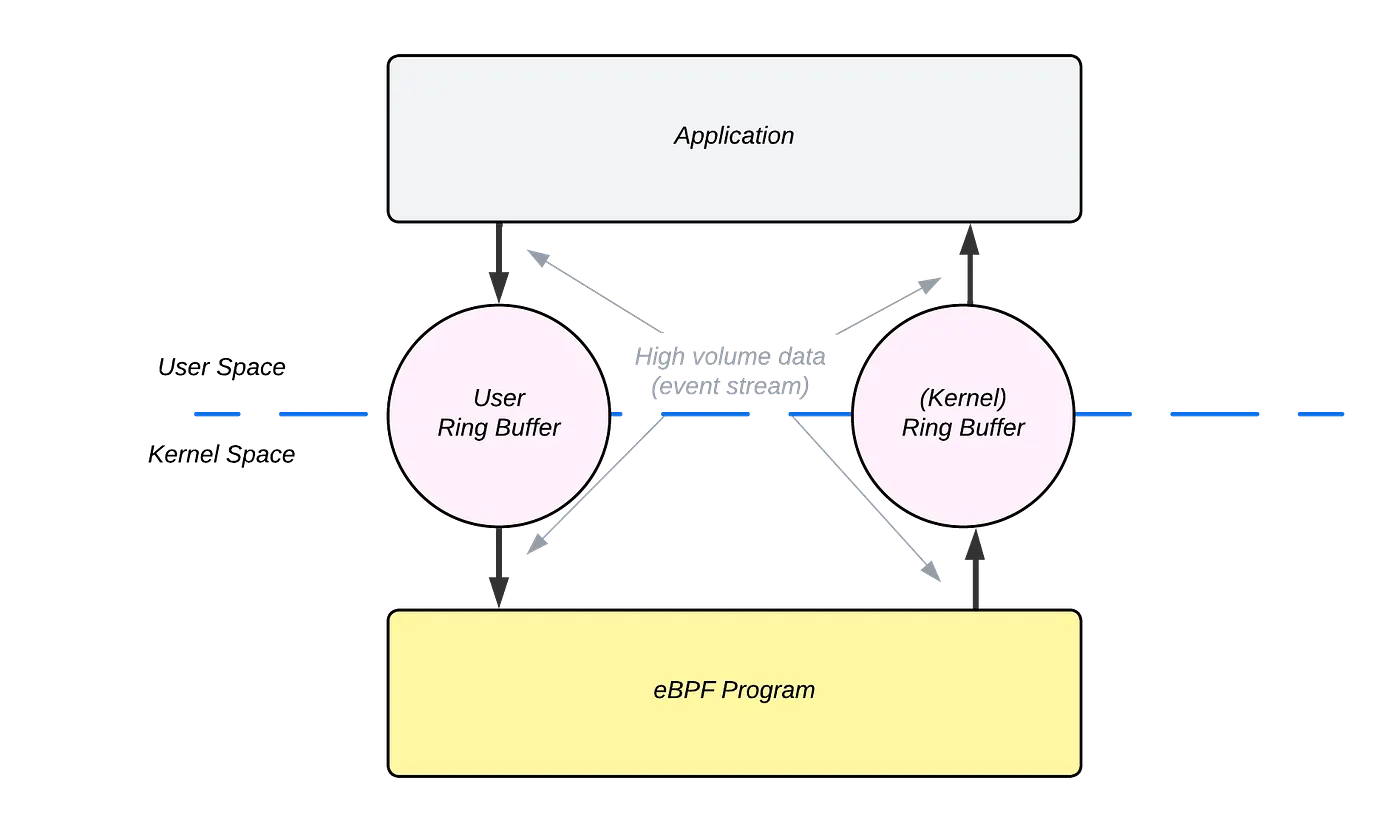
Image yoinked from here
Kernel Ring Buffer
Resources on how to implement kernel ring buffer:
User Ring Buffer
Resources on how to implement user ring buffer: